COVID-19 forecasting
Infectious disease prediction using machine learning
How can we use data from a cross-sectional cohort of patients to predict COVID-19 rates at the national level?
To answer this question, we collected data representative of the COVID-19 pandemic patients in Lebanon from Rafic Hariri University Hospital (RHUH). We analyzed said data for trends in COVID-19 incidence. The main indicator related to COVID-19 rates in this study is the cycle threshold (Ct) value obtained from Reverse-transcription quantitative polymerase chain reaction (RT-qPCR) tests conducted on the patients. This value is normally discarded and only the diagnostic result of the test is reported.
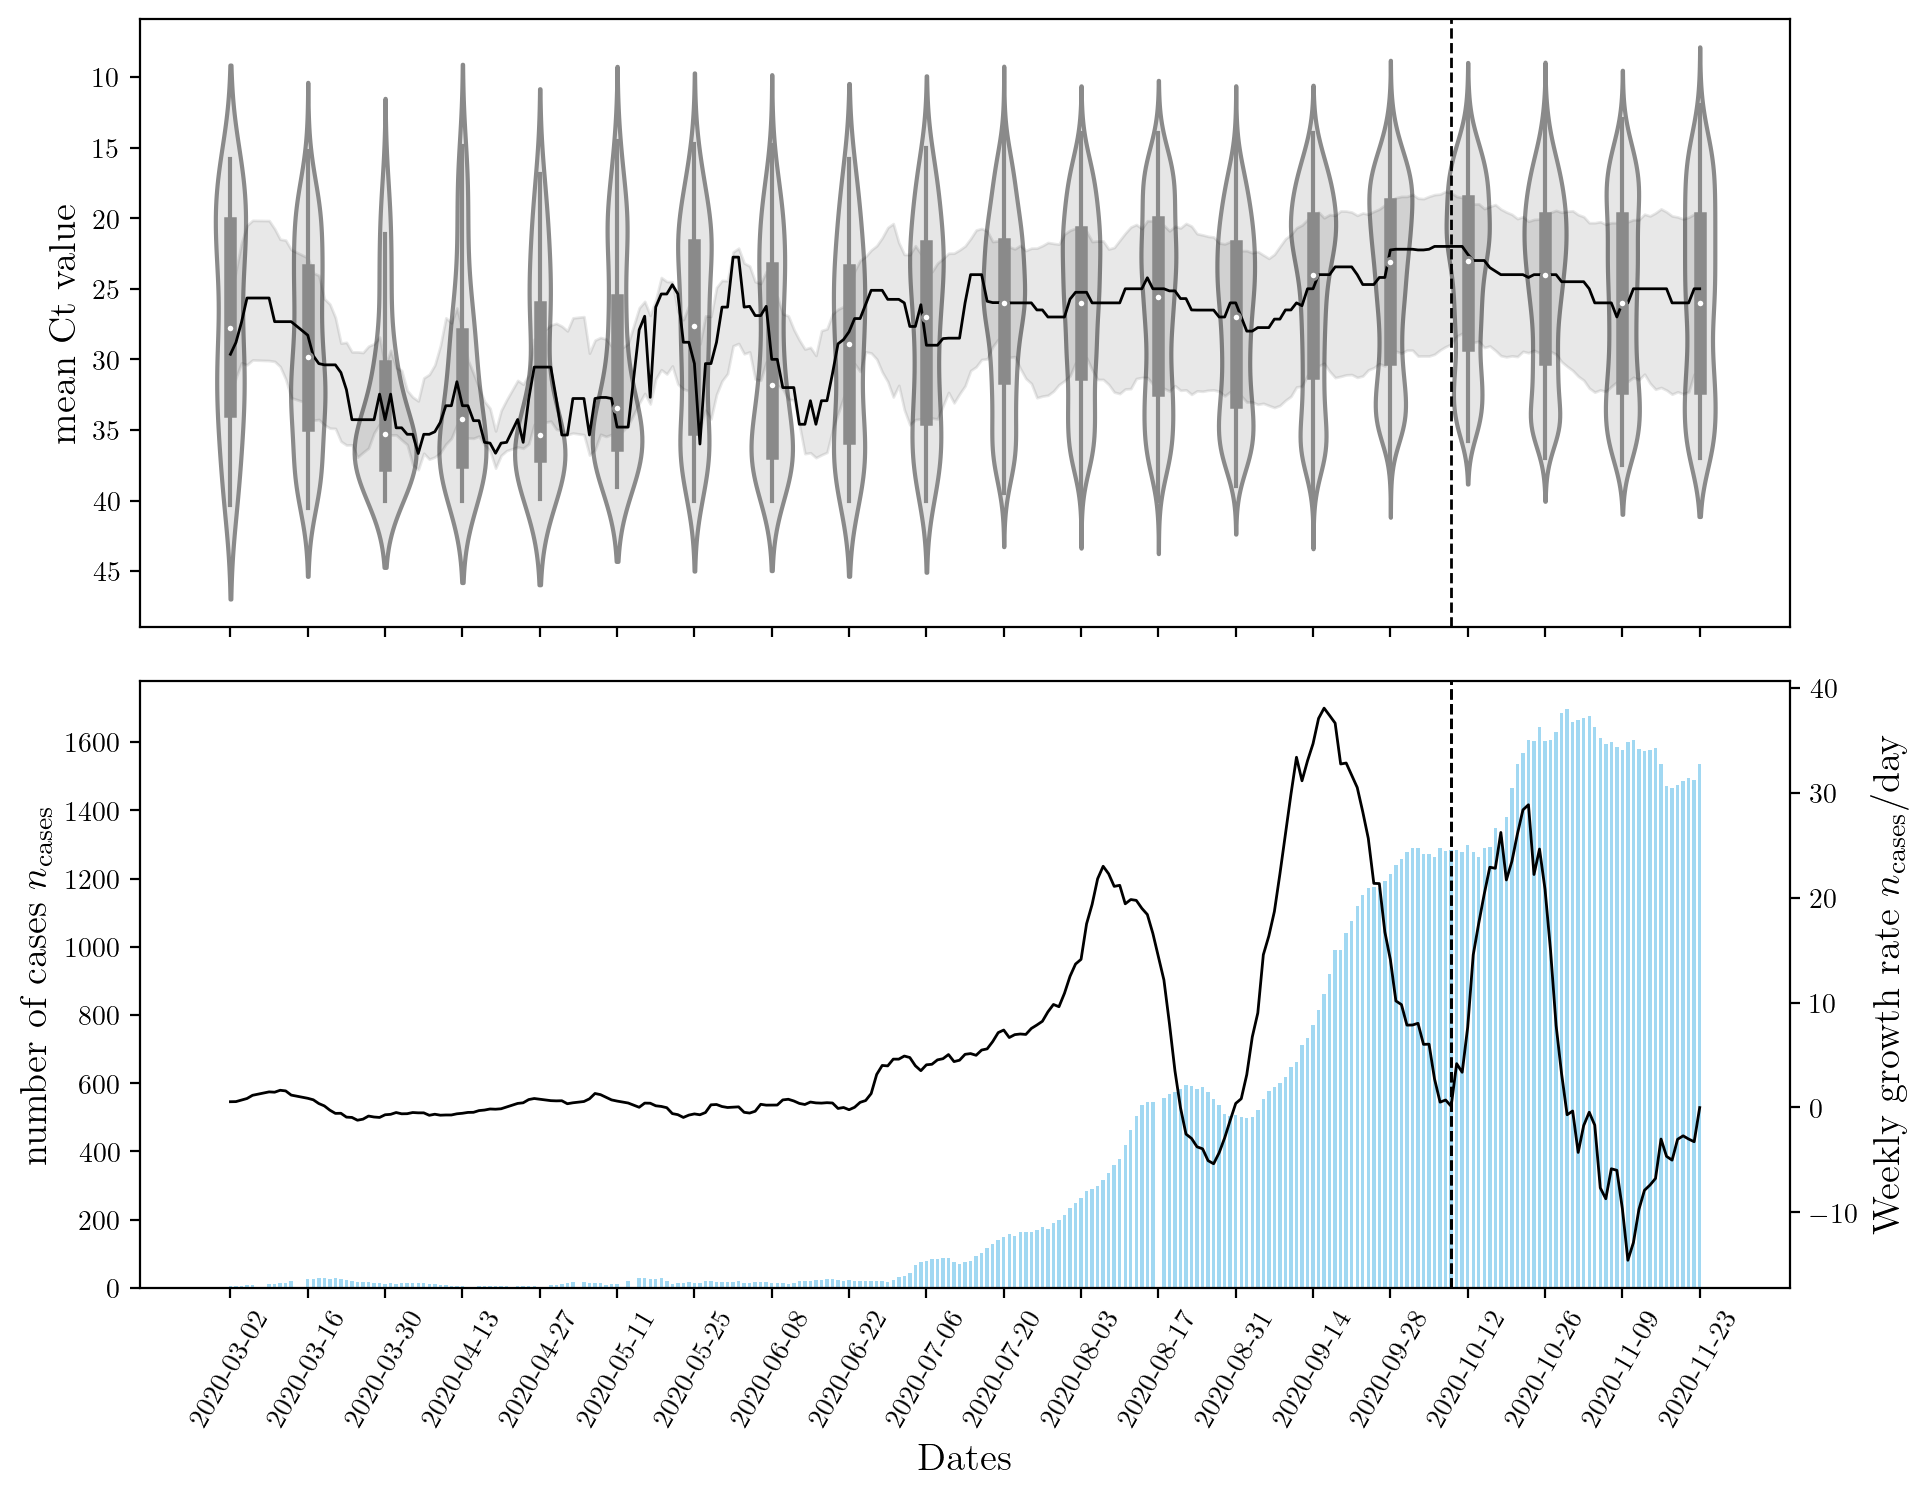
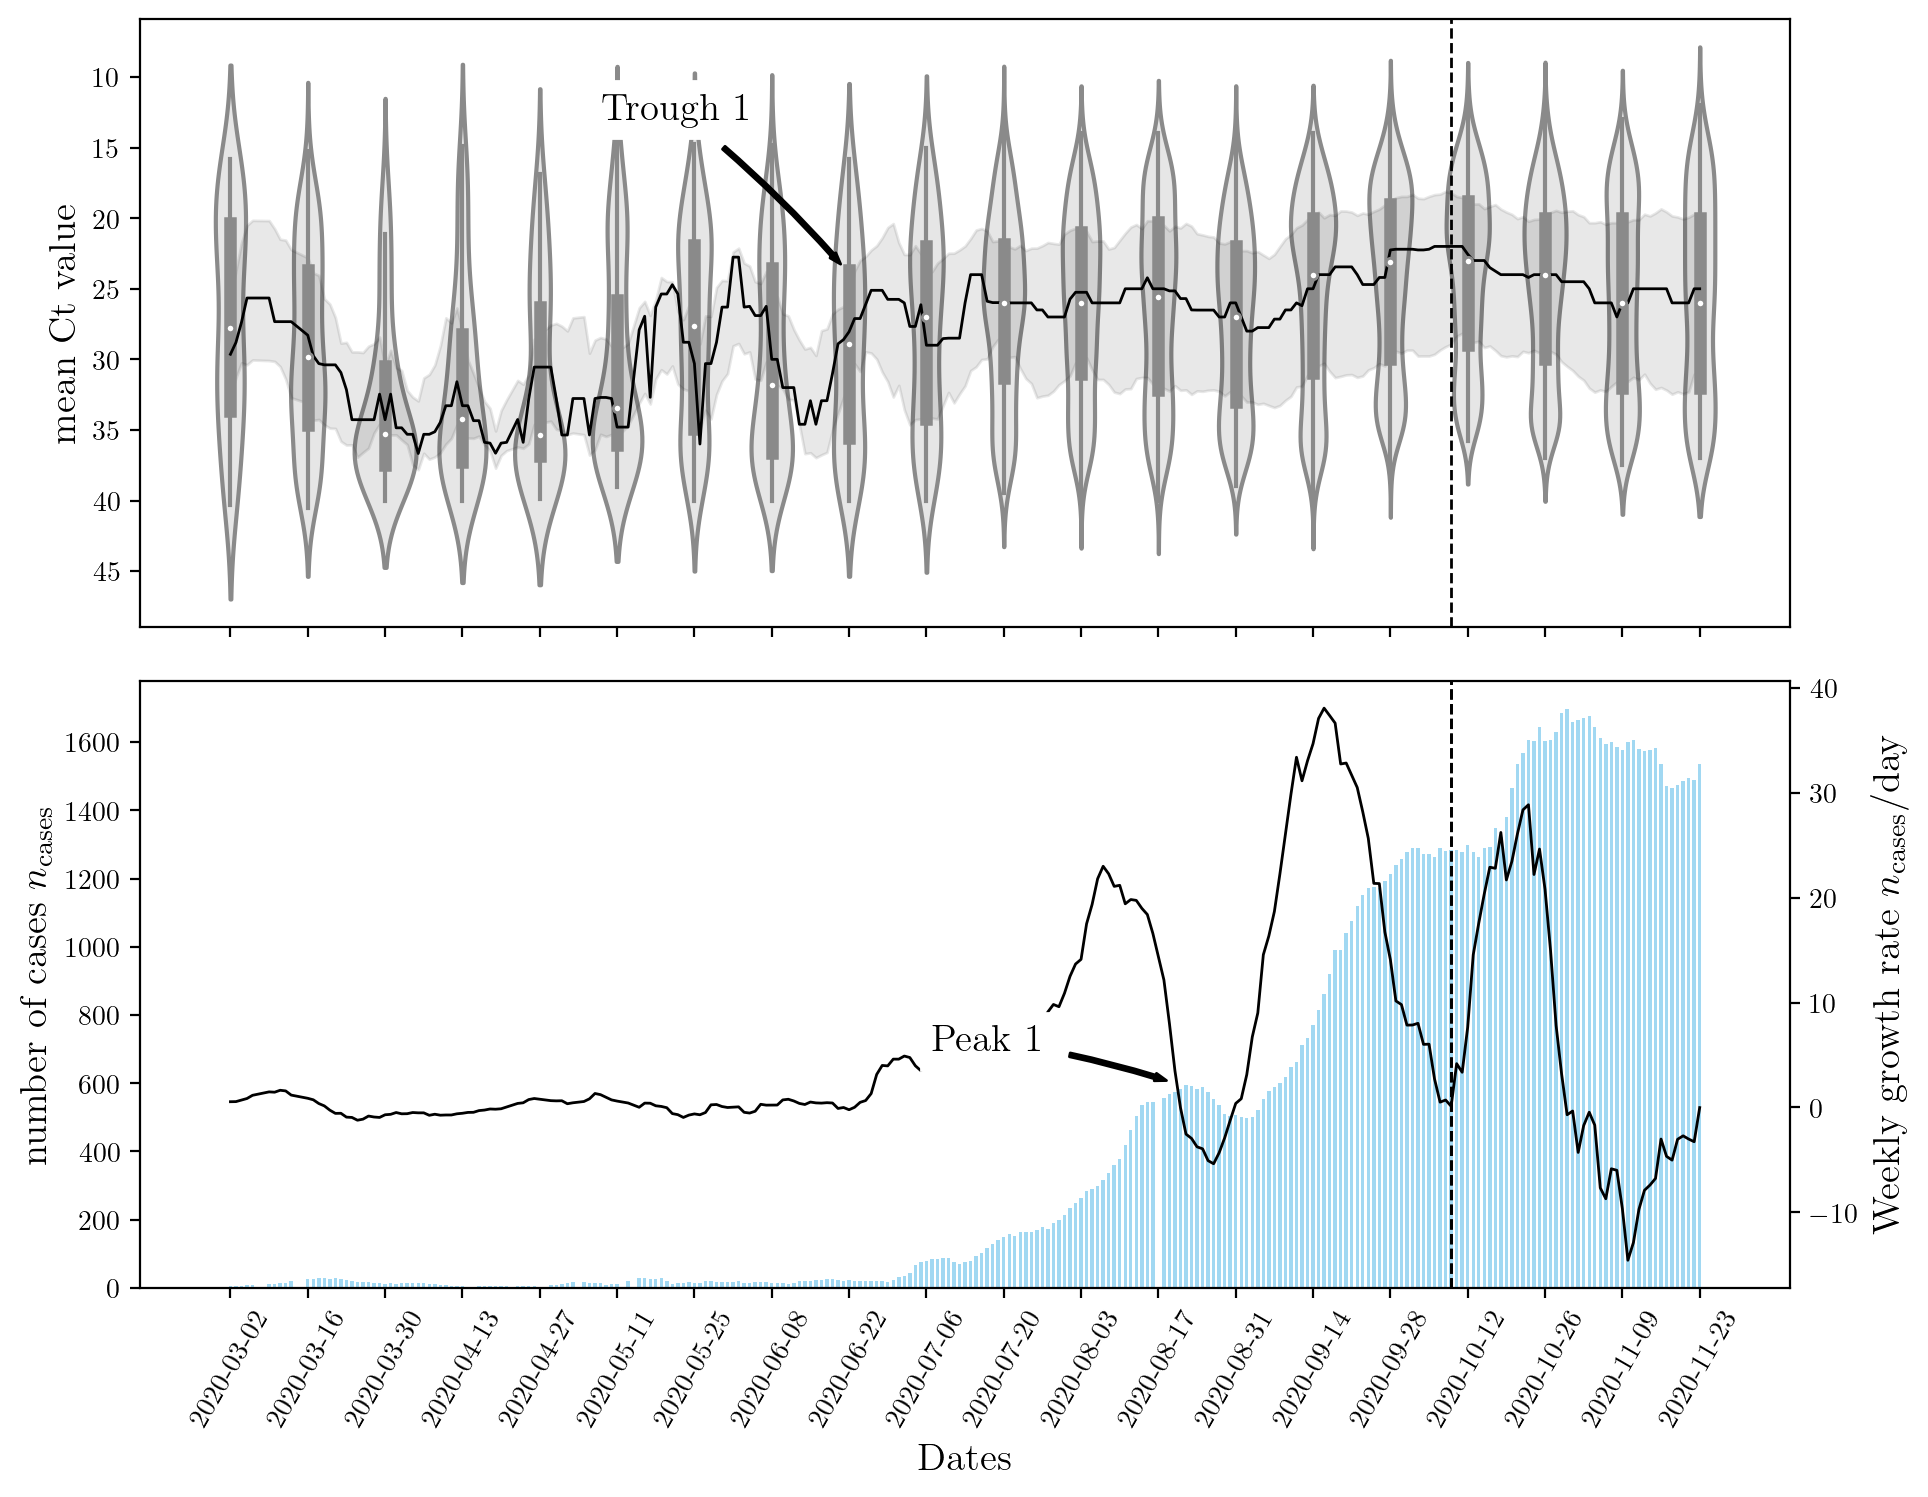
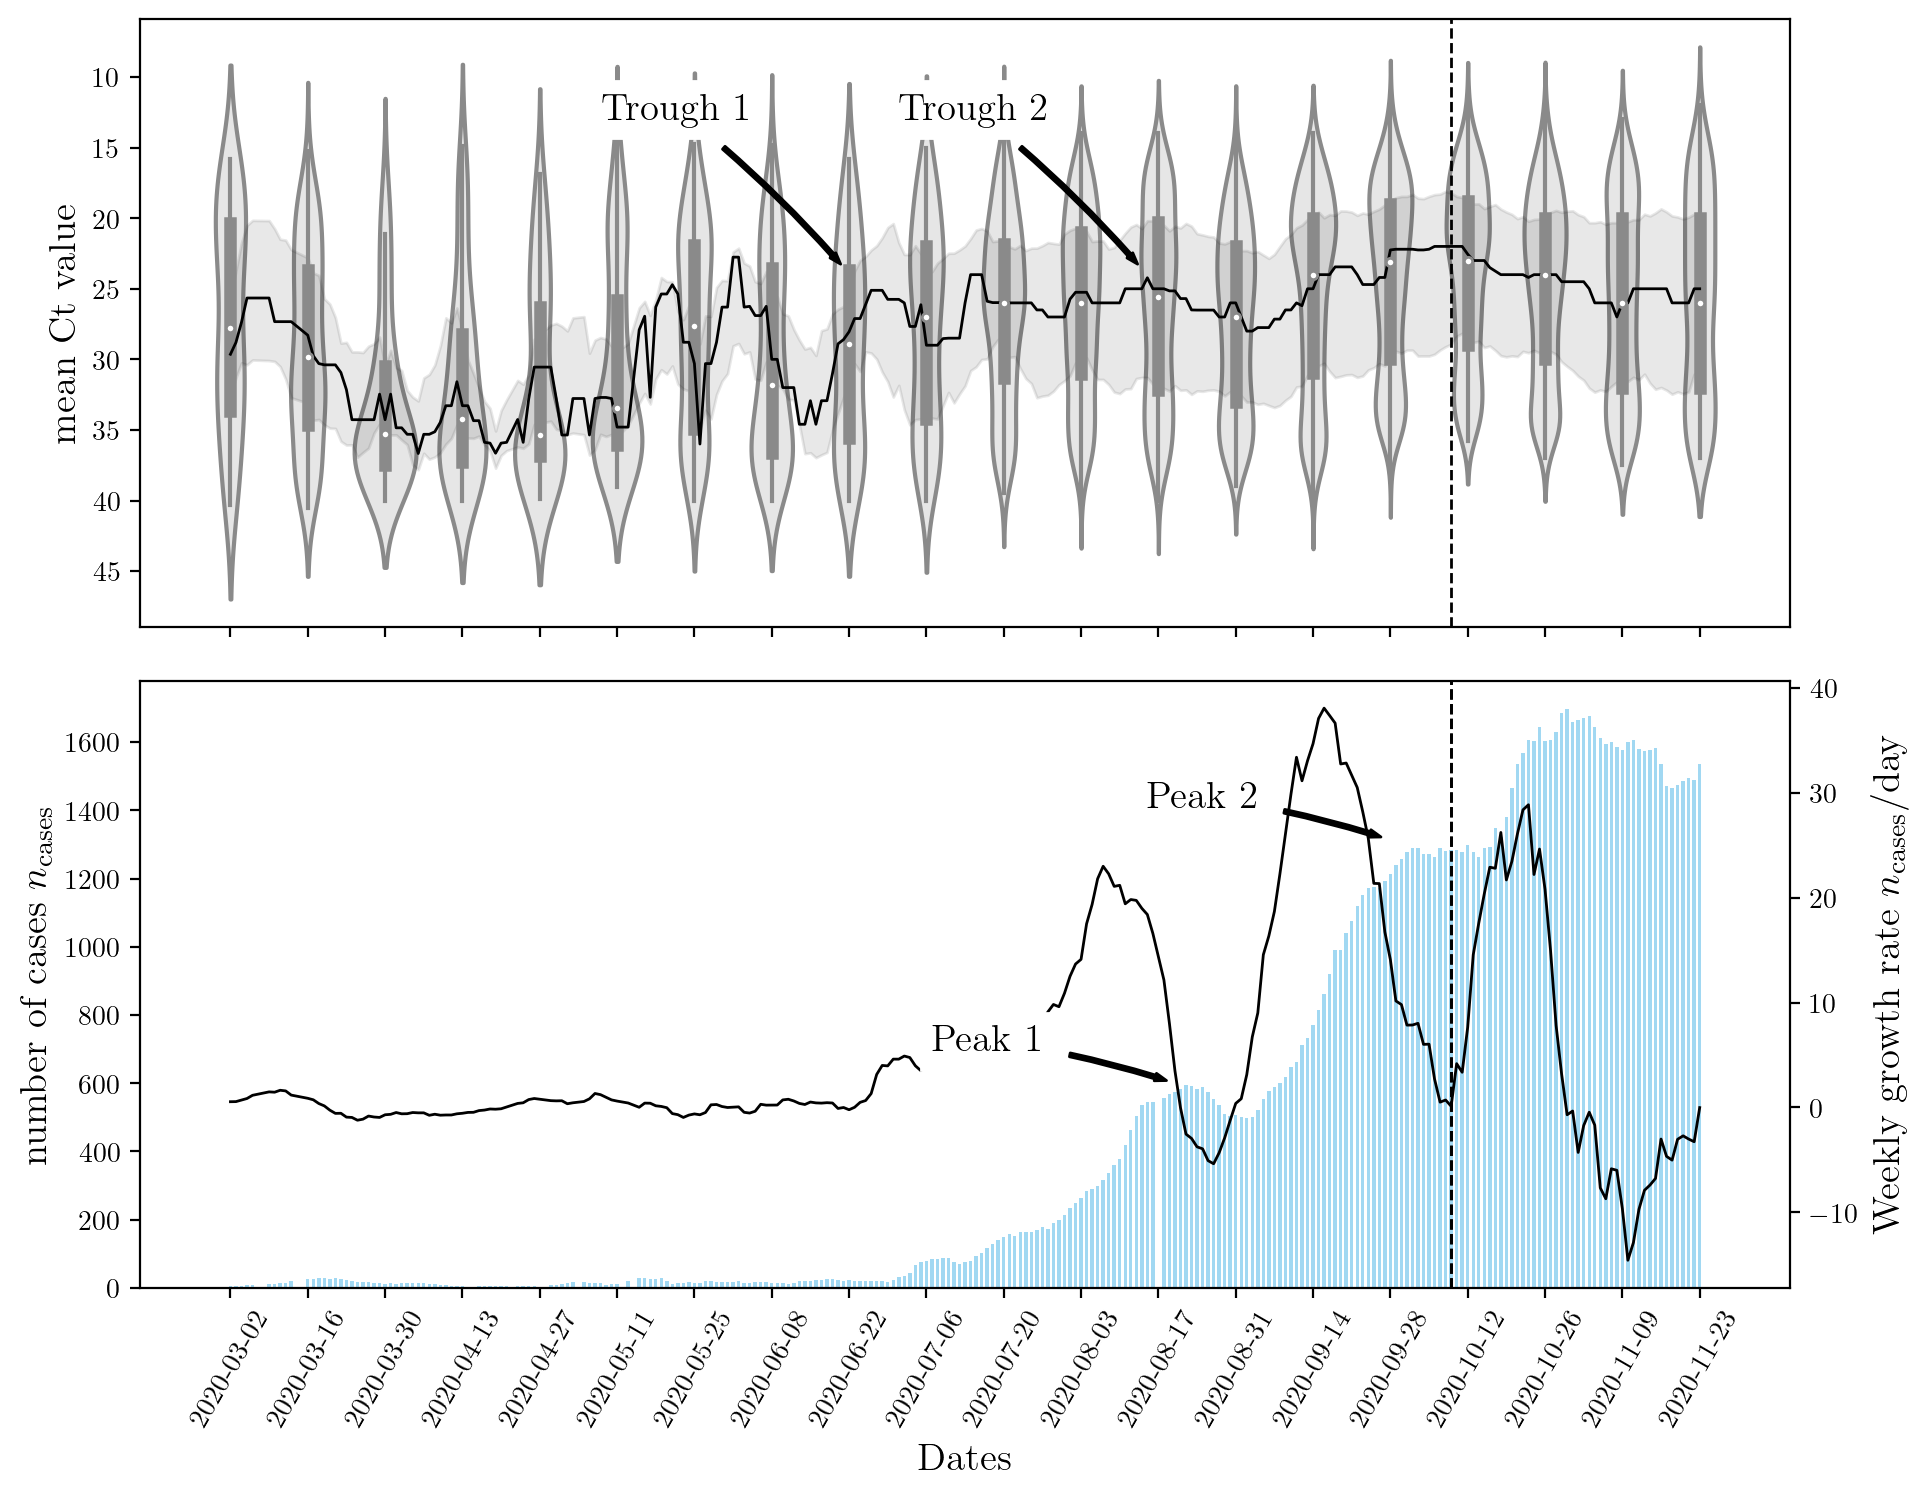
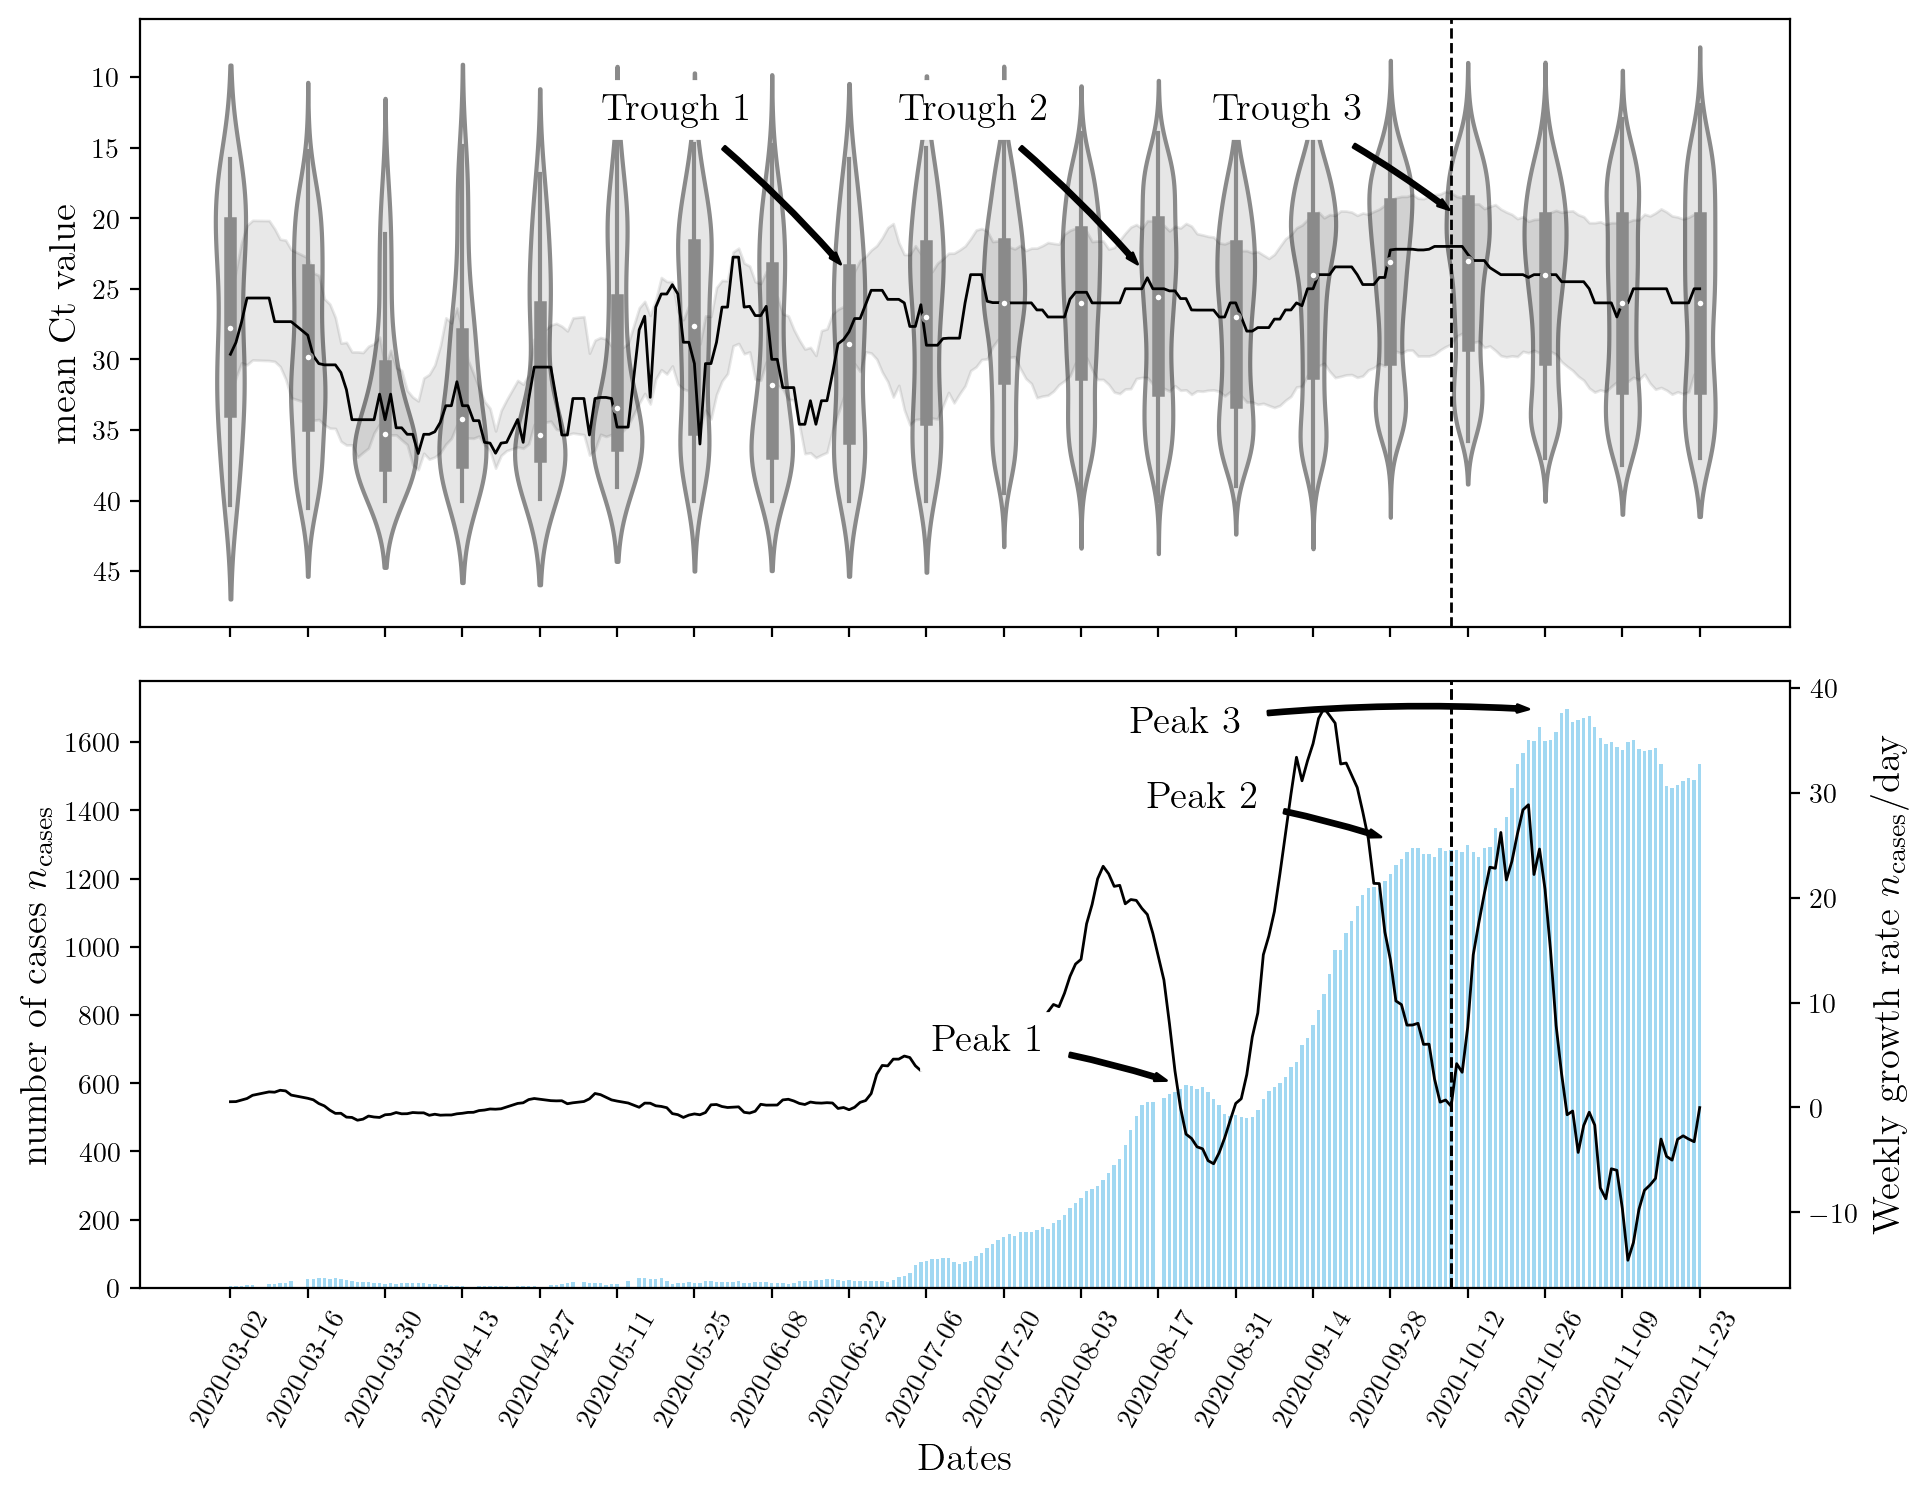
The figure below shows that a sharp rise in Ct leads to an increase in the number of cases observed nationwide. Although this result is expected, there is a lag between the two events. This is explained by population dynamics and the rate at which the disease spreads. Most machine learning models can capture the inverse relationship between the two features (\(n_\text{cases}\), and Ct) but only recurrent neural networks (RNNs) can capture the ‘lag’ or temporal effect.


An encoder RNN was used to capture the effects of Ct and past \(n_\text{cases}\). A decoder RNN was used to forecast the future rise in \(n_\text{cases}\). The structure of these networks is determining by their hyperparameters. Stochastic optimization StoMADS was used to optimize the neural network’s hyperparamters such that the validation error is minimized. This resulted in an impressively low value for the test score on the unseen dataset. The effect of optimization the hyperparameters is shown below for a few examples. Click the button below to cycle through the different models and their hyperparameters.
The final trained model is made publicly available for inference on https://covid-forecaster-lebanon.herokuapp.com/.